Winston Meets OpenTelemetry: Sending Logs to Dash0 from Nodejs

Aug 11, 2025
Featured
Backend
Introduction
Winston has been the go-to logging library for Node.js developers for years. But what if you could keep that familiar API while automatically getting structured, searchable logs that integrate with modern observability platforms?
I’ve previously written about setting up OTel Logging with the LGTM stack using Grafana Alloy and Loki, which gives you powerful open-source observability but requires managing your own infrastructure. Today, I want to show you a different approach, one where the complexity is handled for you. Asetup that lets your team continue using Winston’s comfortable logging methods while seamlessly sending properly formatted OpenTelemetry logs to Dash0 for analysis and monitoring.
Setting up
We’ll take a basic Express.js application and add Winston logging that flows directly into Dash0 through OpenTelemetry. By the end, you’ll have:
Winston configured with OpenTelemetry transport
Rich, consistent log format with service context
Dash0 collecting and analyzing your logs automatically
Familiar Winston API with modern observability benefits
Let’s start with a basic Express app and configure Winston with OpenTelemetry integration.
First, install the necessary packages:
Create the logging configuration with Winston and OpenTelemetry:
That’s it. Seriously. Dash0’s automatic instrumentation handles all the OpenTelemetry integration, formatting, and export automatically by setting few environment variables we'll see in the coming sections.
Create a simple Express application:
Simple Express application
Create a simple Express application:
This is your basic Express API with CRUD operations. Now let’s add Winston logging.
Adding Winston Logging
Winston is a popular, battle-tested logging library for Node.js. With Dash0, you don’t need any special configuration — just create a basic Winston logger and Dash0’s automatic instrumentation does the rest.
The configuration is incredibly simple — just a default Winston logger. Dash0’s automatic instrumentation detects Winston usage and handles all the OpenTelemetry integration, structured formatting, and telemetry export in the background.
Integrating Logging into the Express App
Now let’s add meaningful logging to our Express application using Winston:
Notice how we’re using Winston’s familiar logging methods (logger.info, logger.warn, logger.error) with structured metadata objects. Winston automatically formats these as structured logs and sends them to Dash0.
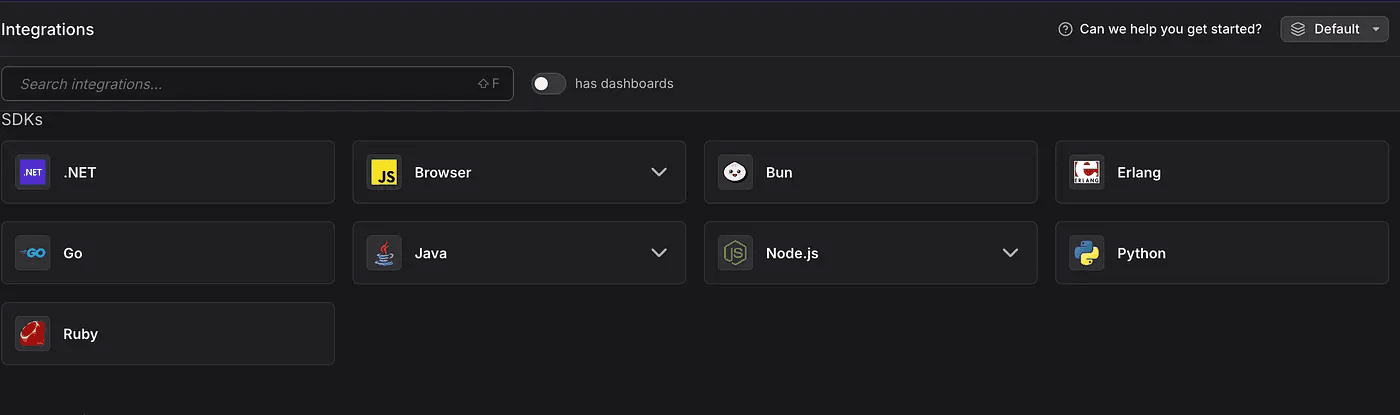
Setting Up Dash0
Getting started with Dash0 is straightforward, but I’ll let their official documentation walk you through the signup and initial setup process: Dash0 Getting Started Guide. You'll see an onboarding screen that looks like this:
Once you’ve completed the setup, you’ll have the environment variables needed to connect your application.
Here’s some of the things you’ll need to set, but follow the official documentation:
That’s it. No complex OTLP exporters, no manual logger provider configuration, no infrastructure setup. Dash0’s automatic instrumentation detects your Winston usage and handles all the telemetry collection and export automatically.
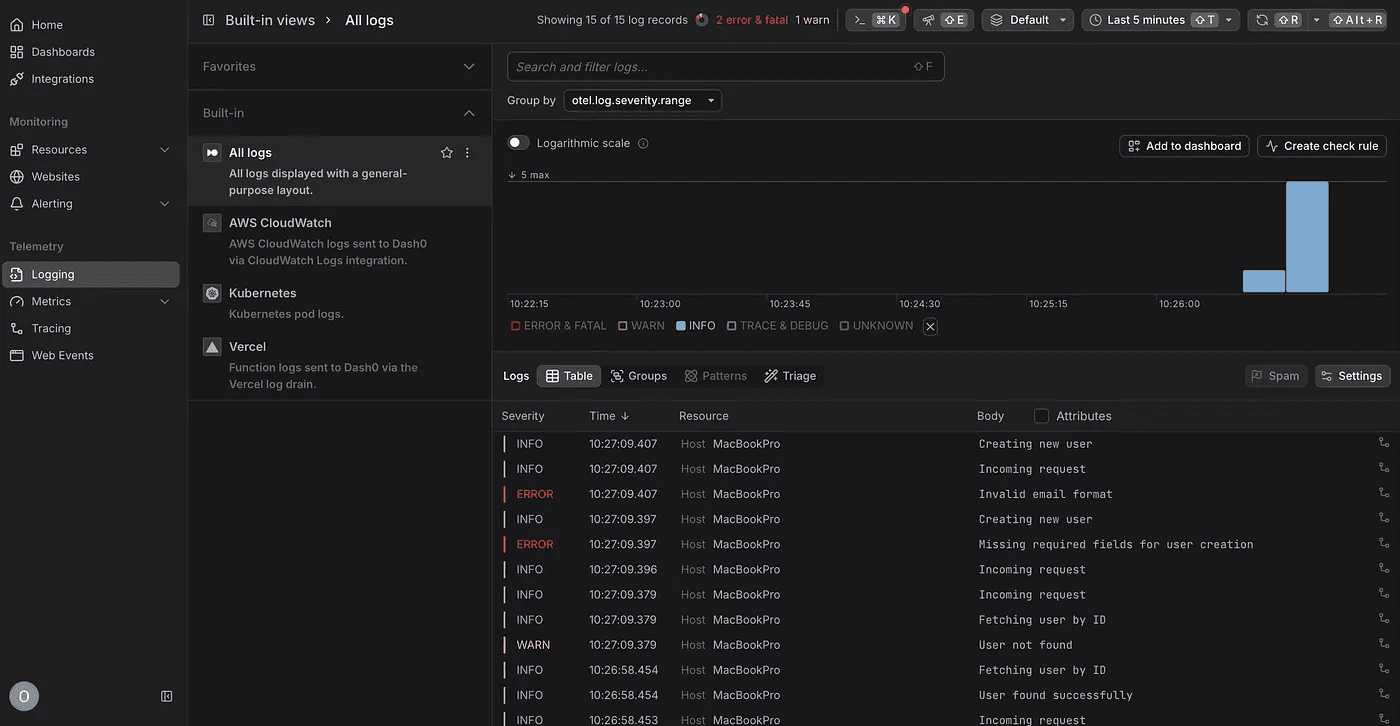
Let’s generate some logs and see them in Dash0:
Let’s generate some logs and see them in Dash0:
In your Dash0 dashboard, you should see these logs appearing with proper structure, service context, and all the attributes you’ve defined. The error logs will be clearly marked and easily filterable.
Conclusions
You now have Winston logs flowing from your Express app directly into Dash0 with structured, queryable format and rich service context. This combines the familiar Winston logging experience with Dash0’s powerful analysis capabilities.
We’ve successfully bridged the gap between traditional Winston logging and modern observability with remarkably little effort. Using just a basic Winston logger (winston.createLogger()) and a few environment variables from Dash0, we transformed simple console logs into structured, searchable telemetry data. No OpenTelemetry packages, no custom transports, no complex configuration - just Winston doing what it does best while Dash0's automatic instrumentation handles all the observability complexity behind the scenes.
The beauty of this approach is that it proves observability doesn’t have to disrupt your team’s workflow. Your developers continue using the familiar Winston API they already know, while your ops team gets the powerful log analysis and monitoring capabilities they need. When you’re ready to add metrics and distributed tracing, this foundation will work seamlessly with those additional telemetry types!
I hope you enjoyed reading this!
Let me know what you think!
Happy logging.
Newer